YouTube SEO Masterclass: Ranking Your Videos

Leveraging YouTube Analytics for Performance Insights
Understanding Your Audience
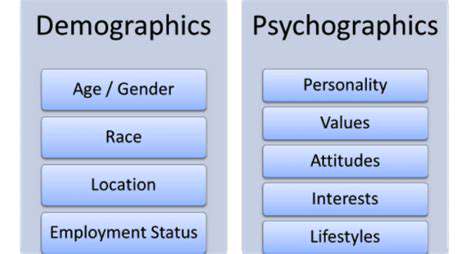
When diving into YouTube Analytics, you'll uncover a treasure trove of data about who's watching your content. This tool reveals fascinating patterns in viewer demographics, locations, and content preferences. By studying this information carefully, creators can craft videos that truly connect with their ideal viewers. You might discover unexpected trends - perhaps your cooking tutorials resonate more with urban millennials or your tech reviews attract international audiences.
The platform's geographic data helps identify regional preferences, while age and gender breakdowns show which demographics engage most. These insights become powerful tools for tailoring both content and marketing strategies to maximize impact.
Analyzing Video Performance Metrics
Every successful YouTuber knows that views alone don't tell the full story. The real gold lies in metrics like watch time, audience retention, and click-through rates. These numbers reveal how viewers actually interact with your content - where they lose interest, what keeps them watching, and which thumbnails compel clicks.
Seasoned creators pay particular attention to audience retention graphs. These visual representations show exactly when viewers drop off, highlighting moments where content might need tightening or restructuring. A sudden dip at the 2-minute mark? Maybe your introductions run too long. Steady decline throughout? Perhaps the pacing needs adjustment.
Identifying Trending Topics and Keywords
The analytics dashboard serves as a crystal ball for emerging trends. By monitoring search terms and suggested videos, creators can spot rising topics before they peak. This foresight allows for timely content creation that rides the wave of growing interest.
For example, a gaming channel might notice increased searches for a particular game mod, while a finance creator could detect growing interest in cryptocurrency taxation. Acting on these insights positions your content at the forefront of viewer demand.
Optimizing Video Titles and Descriptions
Your analytics reveal which titles and descriptions perform best, serving as a testing ground for optimization strategies. The data might show that question-based titles outperform statements, or that including specific keywords in the first 100 characters boosts visibility.
One surprising finding might be that shorter descriptions sometimes perform better than exhaustive ones, contrary to conventional wisdom. Testing different approaches and letting the data guide decisions leads to continuous improvement in engagement metrics.
Understanding Search Performance
The search terms report acts like a roadmap to your audience's mind. It shows not just what searches lead to your videos, but also which queries show your content in results without generating clicks. This reveals untapped opportunities - maybe you're ranking for terms you didn't intentionally target.
For instance, a photography tutorial might unexpectedly rank for best cheap camera, suggesting an opportunity to create more budget-focused content. These insights help refine both existing content and future video planning.
Evaluating Community Engagement
Beyond numbers, YouTube Analytics provides a window into how viewers feel about your content. The ratio of likes to dislikes, comment sentiment, and sharing frequency all paint a picture of audience connection. Engagement metrics often predict long-term channel growth better than view counts alone.
Noticing that tutorial videos generate more comments than vlogs? That might signal where to focus your creative energy. Seeing increased shares on certain topics? Those likely represent your most valuable content pillars.
Tracking Channel Growth and Trends
The growth metrics section serves as your channel's vital signs monitor. Subscriber fluctuations, view trends, and traffic sources combine to show the big picture. Seasonal patterns emerge - maybe your back-to-school content spikes every August, or holiday tutorials gain traction in November.
Watching these long-term trends helps with strategic planning. If you notice subscriber growth slowing despite steady views, it might indicate a need to improve calls-to-action or channel branding. Consistent monitoring allows for timely course corrections.

Read more about YouTube SEO Masterclass: Ranking Your Videos


Hot Recommendations
- Senior Travel Discounts and Deals
- Personalized Travel for Different Seasons and Climates
- Honeymoon Destinations: Romantic Getaways for Newlyweds
- Mythical Places: Journeys to Legendary Locales
- The Future of Travel Agents in an Automated World
- Sustainable Design for Tourist Infrastructure
- Combatting Illegal Wildlife Trade Through Travel Awareness
- The Best Beaches for Relaxation and Sunbathing
- Marine Conservation: Diving into Responsible Ocean Travel
- Measuring the Social Impact of Tourism